
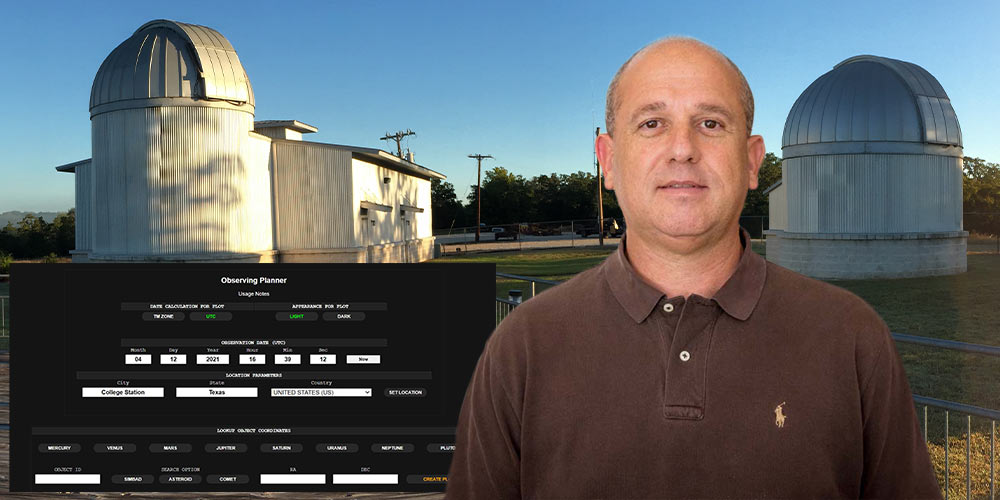
Don Carona, manager of the Physics Teaching Observatory on the Texas A&M campus, has developed a personal website with observing applications for the beginning and advanced hobbyist. He has generously allowed the Brazos Valley Astronomy Club to link to his site in order for others to have access to his work.
When this site is accessed, please be aware of Mr. Carona's request:
Please do not link to any generated image from a page using a timer. For instance, don't have a timer set on your personal web page to update the position of a satellite every second. It needlessly taxes the server several times per second times the number people that are accessing your page. However, you are more than welcome to statically link to any image or data generated by the server.
You will be leaving the Brazos Valley Astronomy Club website when you visit the website or an app.
Don Carona's website is located at http://doncarona.tamu.edu/.
Note: The last word in each heading for each application is a web link to the app. Keep checking the apps page for new or updated versions.
Applications → Charting
The charting application produces an orthographic projection of the celestial sphere for a given field size. The web page offers a simple means of plotting the current positions of the planets with basic ephemeris and event times. Also, on the page is the ability to plot any object given its ID with three available search options depending on the object of interest. For instance, entering “C/2018 V1” for the object ID and selecting the “Comet” button will produce the equatorial coordinates for a bright, recently discovered comet. Choosing the “Chart” button will plot the position of the object on a basic chart with current event times for the Central Time Zone (America/Chicago). Choosing the “Aladin” button will plot its position against the DSS2 color plates using the Aladin Lite Sky Atlas.
Parameters for Typical Observer
I programmed the charting application initially for duplicating the atlas charts from the Peterson Field Guide: Stars & Planets. Students can make a printed copy for annotating and writing notes as part of their observing log. It's actually become a rather powerful application used by dozens of college and university programs. Here's a few parameters that might benefit the typical observer.
Parameter | Value Type | Description
obsv | Any | Sets the chart to use the basic observatory layout.
Should only be used without any other aesthetic parameters.
object | String | The name of the object at center.
Should be
ra | Sexagesimal (hours) or Decimal | The right ascension of the object to be centered.
dec | Sexagesimal (degrees) or Decimal | The declination of the object to be centered.
peterson | Integer | Atlas chart number from the Peterson Field Guide: Stars & Planets
w | Integer | Width of the chart in pixels.
h | Integer | Height of the chart in pixels.
bg | Hexadecimal Color | Background color of the chart.
star | Hexadecimal Color | Color assigned to stars.
grid | Hexadecimal Color | Color assigned to the equatorial grid.
gridlabel | Hexadecimal Color | Color assigned to the grid labels.
conlines | Hexadecimal Color | Color assigned to the constellation lines.
contype | classic or bruton | How the constellation lines are drawn.
conname | Hexadecimal Color | Color assigned to the constellation names and Bayer designation.
showbayer | Any | Show Bayer designations for stars.
magscale | Double | Default is 3. Changes the size of the stars for the given field size.
maglimit | Integer | Max = 18.
field | Double | Field size in degrees presented on the chart.
stroke | Any | Draws the stars instead of filling them. Synonymous with “chart mode” for many desktop planetarium programs.
mlabel | Hexadecimal Color | Color assigned to the label for a Messier Object i.e.(M104).
mcolor | Hexadecimal Color | Color assigned to the icon for a Messier Object
showmessier | Any | Plots the Messier Objects within the current field.
If you're not interested in showing the grid, grid labels or constellation lines, set their respective colors equal to the background color for the chart. Below are some examples using the above parameters.
Stars only centered on M42.
Peterson Chart #42 using "obsv" preset.
Expanded Peterson Chart #42 with white stars on black background.
Applications → Solar System → Earth → Sunlit Earth
A simple equirectangular projection plotting the sunlit region of the Earth with the position of the Sun marked by an icon. The shadowed region includes the current lights-at-night data. As the mouse pointer moves across the image, the geographic position is also displayed.
Applications → Solar System → Earth → Satellites
This application is based very loosely on my complete software package for tracking any artificial object in orbit. By default, the current position of the ISS and its ground-tracks are displayed on a Miller Cylindrical projection. Current ephemeris appears below the image. A few buttons are located at the top of the page to display various satellites and constellations. Here's a secret . . . if you know the NORAD ID for a given satellite, a plot can be created using the link:
http://doncarona.tamu.edu/cgi-bin/trakker?norad=# where '#' would be the official NORAD designator i.e.(HST=20580).
It should be noted that this application will undergo a significant upgrade in the future to handle several upgrades. It does not update automatically nor should you link to an image from a web page with a timer.
Applications → Solar System → Earth → Earthquakes
This is a quick reference to identify the earthquakes registered to the USGS during the given day (UTC). Clicking on the “Place” will link to the specific information about the quake from the USGS. Keep an eye on the area around and north of Dallas, TX. It has become very active over the last few years that could lead to a massive earthquake in the future.
Applications → Solar System → Earth → ADS-B Station
The Observatory is an ADS-B flight tracking station out to 200 NM. This page will display current flights that are ADS-B equipped. The deadline for aircraft to be upgraded with ADS-B equipment is January, 2020. The web page is a modification of a standardized page used by makers of ADS-B equipment, which gets its data from my backing application. The small antenna mounted outside on the north end of the classroom building is the ADS-B signal antenna.
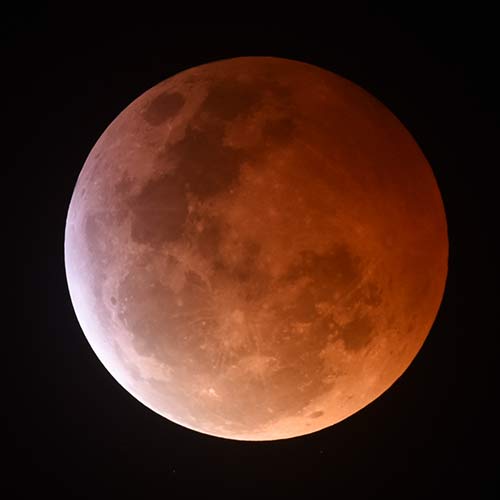
Applications → Solar System → Moon
There are several Moon and Sun related products on this page. Each product has a brief description next to its button; so, I won't go into detail here. All of the products are created using my MEphem code, which is a high-accuracy lunar and planetary ephemeris generator that resides on its own server. It may very well become self-aware someday; so, I keep a close eye on it. All of the lunar renders are derived directly from data gathered by the Lunar Reconnaissance Orbiter (LRO). The “Current Moon”, “Phase Calendar” and “Moon Atlas” are all renders created on-the-fly from the LRO data. At the top of the page is where you'll enter the start time and output parameters for the ephemeris products.
There are two hidden treasures unknown to the world until now that you might enjoy. The lunar phase calendar can be presented as a strip chart for a single month or for an entire year.
Applications → Solar System → Jupiter
This is where you'll find tools for all things Jupiter. At the top of the page is where you'll enter the date of interest. The applications are only concerned with the Julian Date (JD). If you have the JD just enter it in the 'Julian Date' text field and select the button for the product. If you don't know the JD, enter the appropriate information in the Universal Time section.
Applications → Solar System → Saturn
Tools for all things Saturn. Everything here is the same as the Jupiter application noted above.
Applications → Solar System → PDS Viewers
This application offers quick access to the “NASA Planetary Data System: Ring-Moon Systems Node” Planet Viewers. It prevents the need to enter a lot of information into their forms when all you might want to know are the positions of the moon around a given planet. There are a number of excellent tools on their web site, which is linked by button from the page.
Applications → Minor Body
For those interested in minor body hunting or follow-up, everything you need to be successful can be found on the minor body page. There's actually a lot here to discuss and will probably be best to leave the whole concept of minor body hunting to a separate article. In summary, you can get current ephemeris for any known minor body; create an observing report; predict the position of a potential discovery; and verify known objects within a field to flag potential discoveries.
Applications → Minor Body →Ephemeris
This is the ephemeris generated that I programmed with subtle position differences from the Minor Planet Center's (MPC) ephemeris service, which is linked from the page. If you need the coordinates for an object with a near-earth approach, you should use the ephemeris from the MPC since their orbital information for the target will update faster than my service.
Applications → Minor Body → Reporting
The reporting tool is used to generate a report of observations for submission to the MPC. Read the “Usage Information” linked at the top of the page for instructions. If you do not have an observatory code, you must read the MPC's “Guide to Minor Body Astrometry.”
Applications → Minor Body → Vaisala
Vaisala is a method of orbit determination when all you have are a couple of observations preferably spaced a day or two apart. Position Predict is my algorithm for determining the position of a minor body when the observations are spaced apart by hours or days. More information about usage can be found on the page.
Applications → Horizon
Horizon plots the sky using a stereographic projection similar to typical desktop planetarium programs. It has several options for displaying features. If you change the date/time parameters manually, you’ll also need to select the “Rebuild Chart” button to update the plot. Selecting the “Now” button will update the date/time to current and rebuild the chart. Other options add or remove from the chart, but do not update the date/time. When using this or any of my applications that allow you to change the city, state and country, you must tab off of the fields in order for the page to pick up on your changes.
I wrote Horizon for two reasons:
Applications → Spectrum → 1D Spectrum Plot
If your interest is in spectroscopy, I've written a couple of helpful applications to help identify element signatures and create plots from raw 1D spectra. A 1D spectrum is the result of the reduction process of a CCD image taken through a spectrograph. The reduced spectrum will be 1 pixel in height and the width, in pixels, of your detector. At the bottom of the page, you can download a couple of sample spectra taken from the Observatory using our SBIG DSS-7 spectrograph and use those to practice with the plotting app.
Applications → Spectrum → Element Spectrum
This application is an aid to identifying spectral features. The resulting spectrum for any element or combination thereof is based on the NIST measurements and weighted by energy level. Get familiar with the options by using Hydrogen and the “Create as Plot” button. You have up to 5 elements in a single plot. The “Relative Abundance” fields allow you to reduce the levels of particularly strong element signal so that other elements are more visible. For instance, if using both Hydrogen and Sodium, the Sodium signal will over-power the Hydrogen signal. Reducing the relative abundance of Sodium to ~20% will yield a much better result.
Applications → ART (Astrometric Reduction Tool)
The Astrometric Reduction Tool is a way to embed a high accuracy World Coordinate System (WCS) in the header of a FITS file that takes advantage of the Simple Imaging Polynomial (SIP), which accounts for image distortion. This is a public variant of one of the data pipelines controlled by the servers. All of the information about ART can be found on the ART page; so, I won't go into more detail here.
Applications → WebCCD
The most popular app is Web CCD. This is used by astronomers everywhere. It provides a simple means of perfectly matching an imaging system to create detailed finder charts. Enter the appropriate information for your system and the equatorial coordinates for the object-of-interest. The image that is created is exactly what your imaging system should produce. I created this app in order to positively identify the field where a minor body should be located in order to verify that the telescope is pointed correctly. When chasing down faint targets that require a long exposure, it's good to know you're pointed in the right place before wasting the time.
Applications → Planner → Observing Planner
The Observing Planner web application is an easy way to determine when an object will be above the horizon, where the Moon will be located with respect to the object, and ephemeris for the Moon. The resulting plot displays two curves: one for the object and one for the Moon. Both curves are altitude versus time and the object curve is airmass color coded.
Instructions for using this app can be accessed by clicking the Usage Notes at the top of the app.
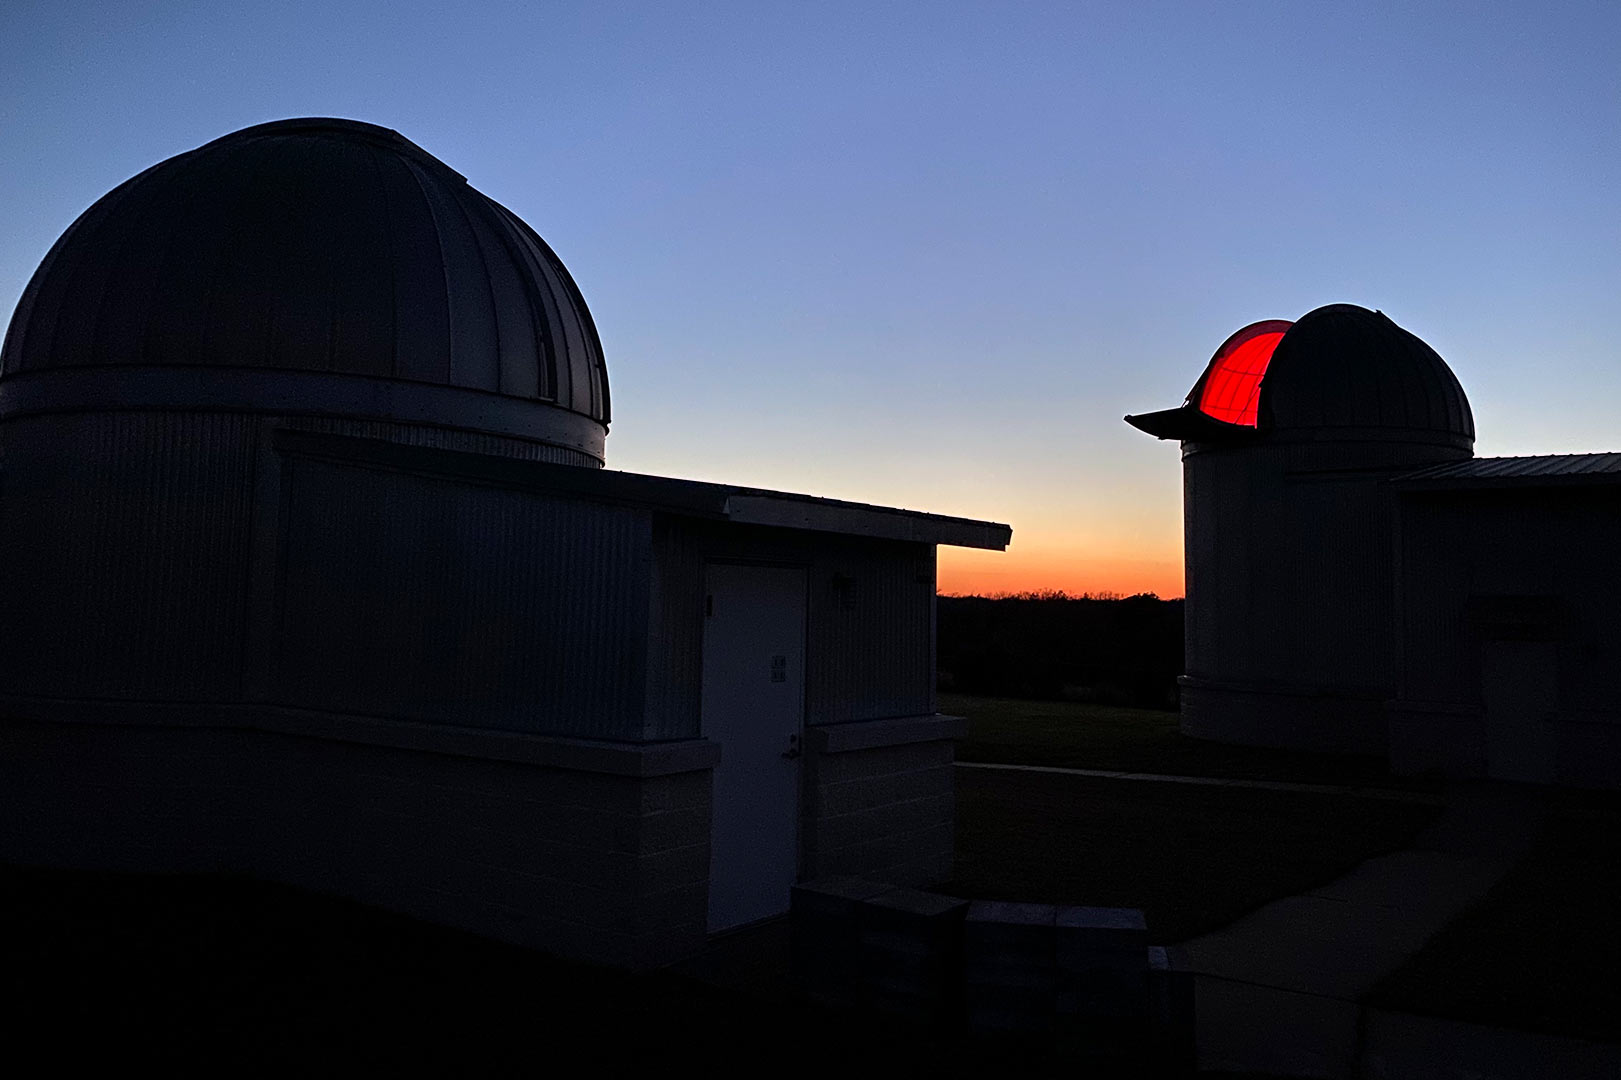
Photo by Don Carona

CONTACT EMAIL:
contact@brazosvalleyastronomyclub.org
Coordinator - Randy Light, M.D.
PROGRAM REQUEST EMAIL:
outreach@brazosvalleyastronomyclub.org
Coordinator - Tom Campbell
GOOGLE DISCUSSION GROUP:
https://groups.google.com
Coordinator - Randy Light, M.D.
© Brazos Valley Astronomy Club
Website by Ginger Wentrcek
Follow Us on Facebook
Member: Astronomical League
Member: Night Sky Network
The Brazos Valley Astronomy Club is a non-profit group located in Bryan-College Station, Texas.
Our goal is to promote astronomy and related science as a hobby for people of all ages.