Page 10

Satellite Tracking App Update
By Don Carona
I've spent the last few rainy nights updating the code for the satellite tracking application on my web server. If you visited the page after my last article, you'll notice some differences when visiting the next time.
The link: http://doncarona.tamu.edu/apps/satellite/
Apps —> Satellite
The first thing you'll notice is that I've added the ability to change the observer's location. This allows the application to tailor the ephemeris for every satellite to the observer. If the location you enter isn't found, it will default to the Observatory's location. If the location isn't within the U.S., the “State” field isn't used.
Satellite Category and NORAD Satellite Number
Next, you'll find the ability to look up and display satellites by category or by the NORAD satellite number. My favorite addition is the new sky view option. When checked, the page will display the satellite's position against the stars. Note however, that only ground tracks can be viewed for the satellite constellation presets i.e. (GPS-OPS, NOAA, etc.).
For each of the look-ups, there is an “update” button. Use these to set the selected satellite or perform a quick update of its position or the view after checking or unchecking the sky view option. When looking up by satellite number, you can enter a comma delimited list into the text field if you want to view multiple satellites on the same map. For instance, “20580,25544”, which is the HST and ISS respectively. Ground tracks are drawn only for the first satellite in the list. If you used a preset button, click on it again to update positions.
When observing the ground tracks over the map of the Earth, the circle above the satellite's name is the precise position of the satellite.
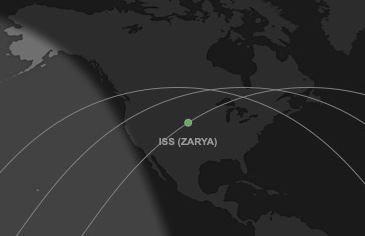
Tracking the International Space Station
If the middle of the circle is black, the satellite is neither passing nor visible to an observer at the location provided. If it's orange, it is passing but not visible. If it's green, the satellite is visible to the observer - run outside and take a look if it's not cloudy. For visible satellites, switching to sky view mode will allow you to see which constellation in the sky to look towards.
It's in Color
A color map option to the web page, next to the sky view option, has been added. It will display a color map with topography and bathymetry instead of the simple gray map.
More Satellite Tracking Stuff
There are more requests to the server for satellite element sets and ephemeris than anything, and both can be easily obtained from the server. A NORAD Two Line Orbital Element Set (TLE) provides the information to calculate the orbit of any artificial satellite from which the ephemeris is derived. Most desktop planetarium applications have some mechanism to display artificial satellites by downloading the TLE's from a source or by the user providing them in the form of a text file. When downloading TLE's, most sites provide the name of the satellite to 24 characters on Line 0, followed by the standard two lines of the element set like the example below.
0 HST
1 20580U 90037B 19026.21067691 .00000443 00000-0 16059-4 0 9990
2 20580 28.4702 80.6555 0002846 25.3666 205.4646 15.09163051379194
The ephemeris for a given satellite depends on the observer's geographic location. The default location is the Observatory. To change the location, use the “geo” parameter, followed by the city, state and country, delimited by commas. The state may be abbreviated. If the country is not the US, no state name should be supplied and the country should be identified by name or code. For instance, setting the location to the city of Salaparuta in Sicily, Italy, would look like this: “Salaparuta,,Italy” or “Salaparuta,,IT”. Note that even though a state is not given, a comma is still included for it!
The ephemeris is delivered as an HTML table by default. If you display this on your web page, the page should define a style named, “ephemtable” or the table will use the browser's default style. To get the ephemeris as pure text, add the “txt” parameter.
Below are some examples:
To get the TLE's for a specific satellite number, use Trakker:
http://doncarona.tamu.edu/cgi-bin/trakker?tle=20580
To get the TLE's for multiple satellite numbers, use Trakker:
http://doncarona.tamu.edu/cgi-bin/trakker?tle=20580,25544
To get the TLE's for an entire category, use Satplot:
http://doncarona.tamu.edu/cgi-bin/satplot?cat=science
To get the ephemeris for a single satellite as a table:
http://doncarona.tamu.edu/cgi-bin/satplot?ephem=20580
To get the ephemeris for multiple satellites as text:
http://doncarona.tamu.edu/cgi-bin/satplot?ephem=20580,25544&txt=1
To get the ephemeris for a different geographic location:
http://doncarona.tamu.edu/cgi-bin/satplot?ephem=20580,25544&txt=1&geo=Boise,Idaho,US
http://doncrona.tamu.edu/cgi-bin/satplot?ephem=20580&txt=1&geo=Salaparuta,,Italy
http://doncarona.tamu.edu/cgi-bin/satplot?ephem=20580&txt=1&geo=Salaparuta,,Italy
Even More Satellite Tracking Stuff
Okay, you might have noticed that there are two different satellite tracking applications: Trakker and Satplot. The application, Trakker, is programmed to find any artificial satellite that has a NORAD number, and that's a whole lot of satellites. It can also be searched by the name of the satellite such as “HST” or “Flying Laptop”. Names should be somewhat specific, because Trakker is only going to return the first one it finds that meets the criteria unless it has manually passed the query with which to perform the search. Trakker has no real graphics capability.
Satplot, on the other hand, is programmed around a small subset of popular artificial satellites that are managed in categories. The categories are derived from Dr. T.S. Kelso's web site, CelesTrak. Satplot performs the heavy lifting when it comes to graphics and map projections. Anytime Trakker is asked to create a ap or plot against the stars, it calls Satplot to do the job. At present, Satplot manages several different map types, including the more common Equidistant Cylindrical (Equirectangular), Miller Cylindrical, Stereographic, and Orthographic projections. The Miller Cylindrical is the default projection.
Here are a few examples of what you can do behind the scenes:
To create a default, Miller Cylindrical projection using the satellite's name:
http://doncarona.tamu.edu/cgi-bin/trakker?satid=HST
To create a default, Miller Cylindrical projection using the satellite's number:
http://doncarona.tamu.edu/cgi-bin/trakker?norad=20580
To create a 1000 x 500 Equidistant Cylindrical:
http://doncarona.tamu.edu/cgi-bin/satplot?norad=20580&map=1
To create just the tracks and satellite for a 1000 x 500 Equidistant Cylindrical:
http://doncarona.tamu.edu/cgi-bin/satplot?norad=26407&map=2&tc=888888&sc=444444
The “tc” and “sc” parameters are hexadecimal track color and satellite color respectively.
Use this for overlaying on your own map, such as those found on Visible Earth.
To create just the tracks and satellite for a 2000 x 1000 Equidistant Cylindrical:
http://doncarona.tamu.edu/cgi-bin/satplot?norad=26407&map=3&tc=888888&sc=444444
The “tc” and “sc” parameters are hexadecimal track color and satellite color respectively.
Use this for overlaying on your own map, such as those found on Visible Earth.
To create a 500 x 500 Orthographic Projection:
http://doncarona.tamu.edu/cgi-bin/satplot?norad=25544&map=4
This is one of my favorites. Perfect for the corner of a web page.
Image Credit: International Space Station Image at Top of Page: NASA